Test Reporting & Dashboards
- AI-Powered Test Script Generation
- Self-Healing Test Automation with AI
- AI-Based Test Impact Analysis
- AI-Driven Defect Prediction & Analytics
- e2e Automation (UI/API/Mobile/DB)
- Parallel & Distributed Test Execution
- Cross-Browser & Cross-Platform Testing
- Cloud-Based Test Automation
- CI/CD Test Integration
- Data-Driven & BDD Automation
- Test Reporting & Dashboards
- Framework Development & Optimization
- Test Data Management & Automation
About Test Reporting & Dashboards
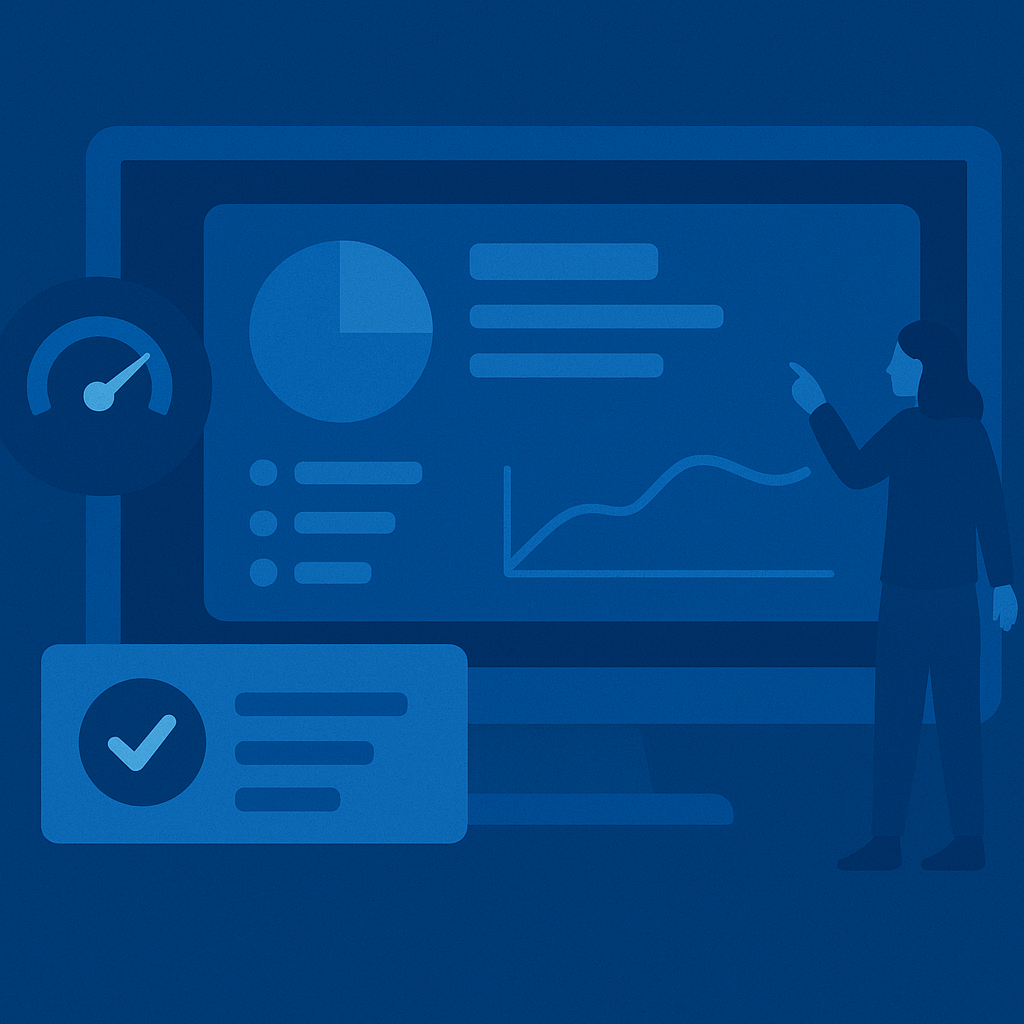
Test execution generates vast amounts of data, but raw logs are not insights. Without clear visualization, it's impossible to understand your product's quality at a glance. Our Test Reporting & Dashboards service transforms this complex data into a clear, actionable story. We build and configure centralized, real-time dashboards that provide instant visibility into your entire testing process. These dashboards consolidate results from all test runs, visualizing key metrics like pass/fail rates, defect trends, test duration, and code coverage. This enables your team to quickly identify failures, spot quality trends over time, and make informed, data-driven decisions, ensuring every stakeholder has a clear view of your application's health.

About Test Reporting & Dashboards

Test execution generates vast amounts of data, but raw logs are not insights. Without clear visualization, it's impossible to understand your product's quality at a glance. Our Test Reporting & Dashboards service transforms this complex data into a clear, actionable story. We build and configure centralized, real-time dashboards that provide instant visibility into your entire testing process. These dashboards consolidate results from all test runs, visualizing key metrics like pass/fail rates, defect trends, test duration, and code coverage. This enables your team to quickly identify failures, spot quality trends over time, and make informed, data-driven decisions, ensuring every stakeholder has a clear view of your application's health.
Our Framework
Our Expertise
Enable Data-Driven Decision-Making
Move from guesswork to informed decisions. Our dashboards provide the objective data you need to confidently assess release readiness and prioritize improvements.
Achieve Full Visibility into Quality
Get a 360-degree view of your testing efforts and product quality in one place. Instantly understand the health of your application at any given moment.
Accelerate Root Cause Analysis
Our interactive dashboards allow your team to quickly drill down into failures, access logs and screenshots, and identify the root cause of bugs much faster.

Our Expertise

Enable Data-Driven Decision-Making
Move from guesswork to informed decisions. Our dashboards provide the objective data you need to confidently assess release readiness and prioritize improvements.
Achieve Full Visibility into Quality
Get a 360-degree view of your testing efforts and product quality in one place. Instantly understand the health of your application at any given moment.
Accelerate Root Cause Analysis
Our interactive dashboards allow your team to quickly drill down into failures, access logs and screenshots, and identify the root cause of bugs much faster.
Ready to Transform Your Testing Process?
Take the next step towards efficient, reliable, and comprehensive testing solutions.
Trusted by 100+ companies worldwide • Enterprise-grade security • 24/7 Support